Many districts, schools, and teachers rely on interim assessments. Most are well designed, with strong attention to measuring student knowledge of content and skills accurately and quickly. Most also provide different types of scores that can be used to understand student performance and student growth over time. Sarah Quesen, Deputy Director of WestEd’s Assessment Research and Innovation program, shares insights on norm-based scores (e.g., percentiles) and criterion-referenced scores (e.g., performance levels), important differences in how they describe student growth, and implications for interpreting scores after the pandemic.
Naya earns a scale score of 530 on both her English Language Arts (ELA) test and her mathematics test. These tests report scores on the same 200–600 scale. Naya is pleased with her high score, but is surprised to find that the same scale score places her in the 98th percentile on the ELA test but barely above the 75th percentile on the math test. The distribution of students’ scores in mathematics has many examinees who are strong in math—the top of the scale is “crowded.” Therefore, Naya is only scoring at or above 75 percent of her peer group in mathematics.
What happens when the bottom of a scale is crowded? If a lot of students are struggling with grade-level content on which norms are based, a lower test score may earn a higher percentile ranking—maybe Naya would only have needed a score of 480 to be at the 98th percentile in ELA.
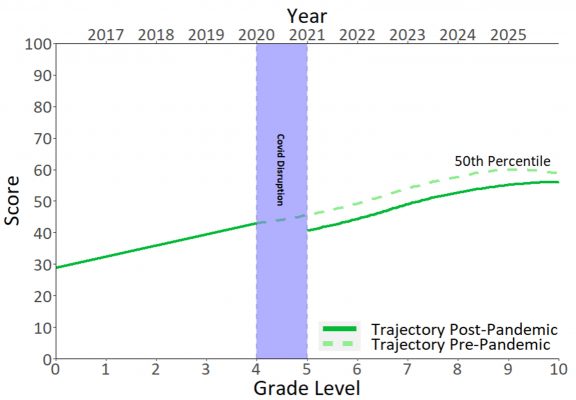
To further complicate things, what if a major event, like the COVID-19 disruption, affects learning for many students? If scores are reported using national norms set before the event, we will observe a drop in student performance based on percentiles post-event (Betebenner & Wenning, 2021); however, if scores are reported using norms set after the event, the percentile ranks will appear largely unchanged. Using norms set after most schools reopened in 2021, students who were in the 50th percentile before the shutdown may continue to be at the 50th percentile according to current state or local norms. But, they may score lower on standards-based assessments, which report on performance in terms of the standards they are based on, rather than in terms of comparisons to other students (figure 1).
Figure 1: How a 50th-percentile growth trajectory may have changed after the COVID-19 disruption.

Relative performance vs. performance expectations.
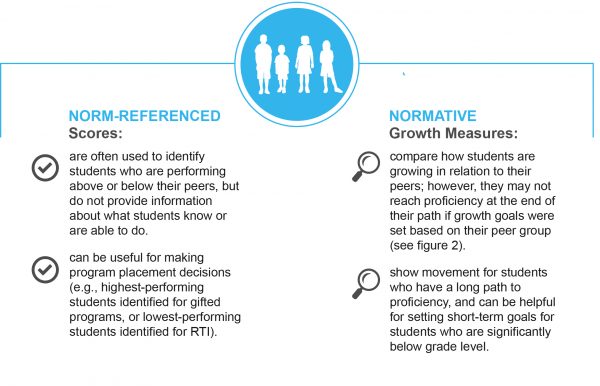
Percentiles are norm-referenced scores. The definition of a percentile is the percent of the population falling at or below a given score. If you are in the top 10 percent of the class, you are in the 90th percentile.
Normative growth measures are growth trajectories based on percentiles. They examine how much a student grows, compared to other students. A common example is the growth chart found in every pediatrician’s office. These types of measures provide useful information on expected student performance, relative to their peers, over time, and highlight when a student is growing faster or more slowly, compared to their peer group. But relying solely on normative growth goals may not lead to proficiency, since grade-level proficiency is based on content standards, not on relative standing among peers. Norm-referenced growth can show movement for students who have a long path to proficiency, which can be helpful for setting short-term goals for students who are significantly below grade level.
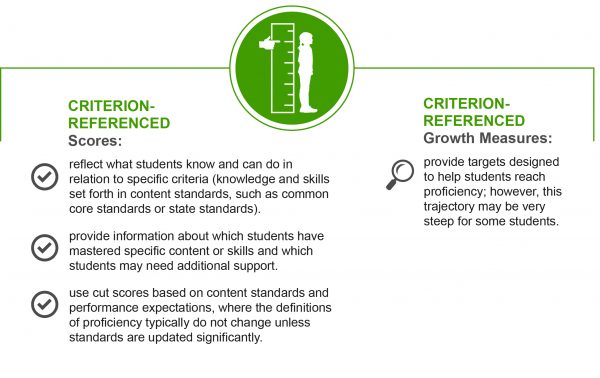
Criterion-referenced scores, such as scale scores, measure what a student knows and can do, based on content standards. Typically, these scores are based on the academic achievement standards set by a state. Criterion-referenced tests have a proficiency cut score, and sometimes have additional cut scores to define additional performance levels, such as “approaching expectations” or “exceeds expectations.” These are set via a “standard setting” process, a process that aims to identify the score that identifies students who show just enough mastery to merit classification at each level.
Criterion-referenced growth measures, such as growth-to-standard measures, provide feedback to students to help them make progress toward the next performance level. These measures identify where a student is scoring on the scale and where they need to score to reach proficiency. Content strengths and weaknesses are identified, and a growth path tied to proficiency is outlined for students. This standards-based feedback can be used to inform instruction, which is a key distinction between criterion-referenced growth and norm-referenced growth. While criterion-referenced growth targets are designed to help students
reach proficiency, this trajectory may be very steep for some students. Many assessment systems provide both norm- and criterion-referenced scores.


Not all paths lead to proficiency.
Unlike norm-referenced growth trajectories, where students are measured relative to their peers, proficiency expectations across time generally do not change unless there has been a significant update to the assessed standards. Norm-based growth is not tied to these expectations; therefore, a norm-based growth trajectory may or may not lead to proficiency. For example, students may continue to make steady progress at the 60th percentile on a norm-based growth trajectory, but when the proficiency standard of “meets expectations” is overlaid, a student at the 60th percentile may fall in and out of meeting expectations. Figure 2 illustrates this, showing normative growth where students on each trajectory improve over time, but when the criterion-referenced proficiency expectation is included (right), the student growing at the 60th percentile does not consistently meet proficiency expectations.
Figure 2: The left plot shows normative growth measures; the right plot adds the criterion-referenced proficiency expectation.

When thinking about scores, consider the purpose.
Which scores should be used? Both norm-referenced and criterion-referenced scores have value. Districts should consider how teachers, students, and others will use the data. Is the test a screener test for students performing at the 20th percentile or below? Are the results designed to inform what content a student needs to master to pass a state’s summative assessment or graduation exam? No matter how a score is reported, the use and interpretation should be clear.
Criterion-referenced growth measures set expectations based on mastery, rather than on the relative performance of one’s peers. Feedback on content-area strengths and weaknesses can directly inform instruction and can potentially accelerate students’ progress toward proficiency. As shown in figure 2, normative growth at the 60th percentile could result in moving closer to or farther away from the criterion target, depending on where the student started. Criterion-referenced growth clearly defines the proficiency finish line for students and provides benchmarks along the way to target instruction to help them get there.
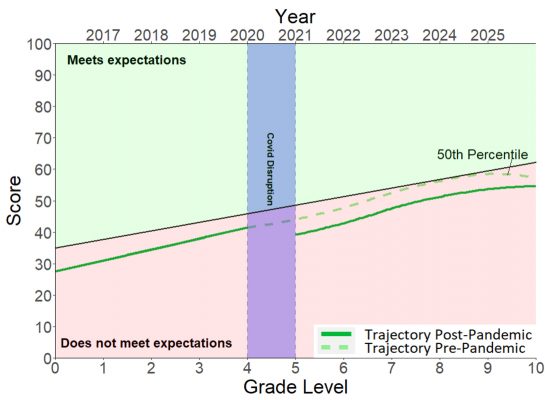
The COVID disruption has shown the value of classroom instruction, and some possible pitfalls of population-dependent growth trajectories. Using static national norms pre- versus post-pandemic, students may have dropped in percentile rank between 2019 and 2021, based on pre-COVID norms. Students who were going to meet expectations on a norm-referenced growth path may have lost ground (figure 3) and may not catch up without targeted intervention. Norm-referenced scores are not designed to show what a student knows and can do, and during times of great disruption, relative metrics can be confusing. If a 2017 peer group defines the percentile of a 2021 student, and then a 2022 peer group defines a 2023 student in the future, how will teachers interpret these scores?
Figure 3. How a trajectory that was on track to meet expectations will not meet expectations after the COVID-19 disruption without targeted instruction.

References
Betebenner, D. (2009). Norm- and criterion-referenced student growth. Educational Measurement: Issues and Practice, 28(4), 42–51.
Betebenner, D. W., & Wenning, R. J. (2021). Understanding pandemic learning loss and learning recovery: The role of student growth & statewide testing. National Center for the Improvement of Educational Assessment. https://files.eric.ed.gov/fulltext/ED611296.pdf
Castellano, K. E., & Ho, A. D. (2013). A practitioner’s guide to growth models. Council of Chief State School Officers. https://files.eric.ed.gov/fulltext/ED551292.pdf
Data Quality Campaign. (2019). Growth data: It matters, and it’s complicated. https://files.eric.ed.gov/fulltext/ED593508.pdf
Perie, M., Marion, S., & Gong, B. (2009). Moving toward a comprehensive assessment system: A framework for considering interim assessments. Educational Measurement: Issues and Practice, 28(3), 5–13.
Schopp, M., Minnich, C., & D’Brot, J. (2017). Considerations for including growth in ESSA state accountability systems. Council of Chief State School Officers. https://ccsso.org/sites/default/files/2017-10/CCSSOGrowthInESSAAccountabilitySystems1242017.pdf

